Vector features are represented by points, lines, or polygons. The US Census for example counts population and other demographic variables and tabulates them at various geographic levels. Tracts are geographic areas – polygons – defined by the US Census Bureau, designed to conform to natural and built boundaries like rivers and roads, and to contain areas populated by about 5,000 people. Nevertheless, population does vary from tract to tract, and this information – along with many other demographic and socioeconomic data – can be mapped at this level.

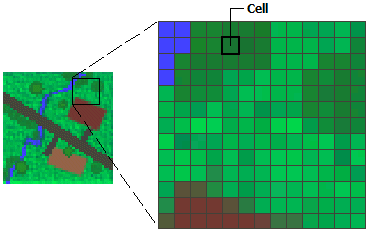
Many places around the world have no national census, or it occurs infrequently. NASA SEDAC’s map of estimated population displays population data as a raster, and is based on a number of sources which can be examined in the metadata here. Raster data are comprised of rows and columns of squares or rectangles (“cells”) of equal dimensions. Each cell in a raster is associated with a numeric value. The numeric value stored in each cell may represent a directly measured or modeled observation, a ranked value (e.g. susceptibility to wildfires from least to most susceptible) or a value that defines a class, group, category, or membership (e.g. landcover).
Explore the NY Snow Survey Maps at the Northeast Regional Climate Center (NRCC), based at Cornell University. The locations from which these observations were reported are represented by points on the map. (Note that the points have been shaded based on the number of inches of snowfall observed.) The state and municipal boundaries are represented as lines or empty polygons.
Now visit the NRCC Climate Normal Maps and select Snowfall as the variable to map on the right. These are interpolated (estimated) amounts based on recorded observations throughout the mapped area. This information is represented as a raster.
>> Get Involved: Start geospatial mapping in Vassar courses, internships, or with Hudson Valley Mappers